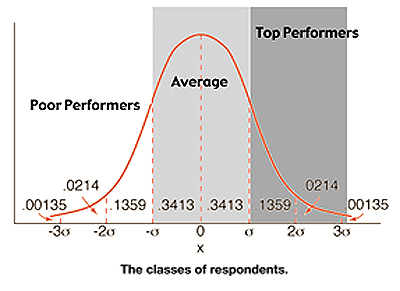
 In general, the Brockmann Methodology arithmetically manipulates groups of answers to specific questions to test the linkage of the central hypothesis of the research. The independent variable (x), is then aligned lowest to highest and segmented into three statistically relevant groups simply by virtue of where they fit in terms of the variable:
- The Market Average being the largest group represents 68.2% of the respondents centered around the mean, the average result. It includes the average result and all those respondents scoring within plus or minus one standard deviation from the average.
- The Poor Performers are the lowest (worst) 15.9% of scores.
- The Top Performers are the highest (best) 15.9% of scores.
The business results or endogenous variable (y) of the Top Performers are compared with the business results of the Poor Performers. If there are business implications of significance we then analyze the operational, organizational and business process dimensions of the Top Performers as compared to the Poor Performers.
From this analysis recommendations to improve business performance can be developed and shared.


